PCsat Telemetry
US Naval Academy Satellite Lab, Bob Bruninga, WB4APR
The Worldwide Internet APRS Data Collection System: The graphic Telemetry links below give the complete telemetry as captured by the worldwide APRS Internet system and archived on Steve Dimse's FINDU.COM database. This system demonstrates the power of using internet linked amateur satellite ground stations around the world to capture live telemetry data for use anywhere. This first image is of the overall PCsat Telemetry System so that you can see how the data is organized into Voltages, Currents, Temperatures and Switch status.
Telemetry Description: The data shown in the graphics links below is 100 days worth from 1 December 2001 to 10 March 2002. The data is presented in its raw form with each telemetry value showing as a color dot in the upper portion of each graphic. The middle green/red color bars show the ON/OFF status of the 13 telemetry bits. Red means ON or "0". The large lower section shows the count of the 001-to-999 telemetry frame counter. It gives a good view of the continuity of the data over ground stations and the occurrence of any random resets that would reset the couter to 001.
NOTE: These plots cover exactly 100 days of data, but the data is presented as contiguous data points, not linearly with time. So the Side A telemetry appears longer because more data points are captured on the larger number of IGate stations monitoring the 145.825 downlink than on the USA-only monitoring stations on 144.390. Also, any data that may be missing will simply concatenate the data rather than showing a gap. Thus the TIME axis only has two known points, The start on 1 Dec and the end on 9 March. Further there may be lots of data missing from the A side plots because you can see the time that the GPS was turned ON is significantly different between the A side and the B side, though they both read the same telemetry value. So be careful of significant distortions in the horizontal TIME axis.
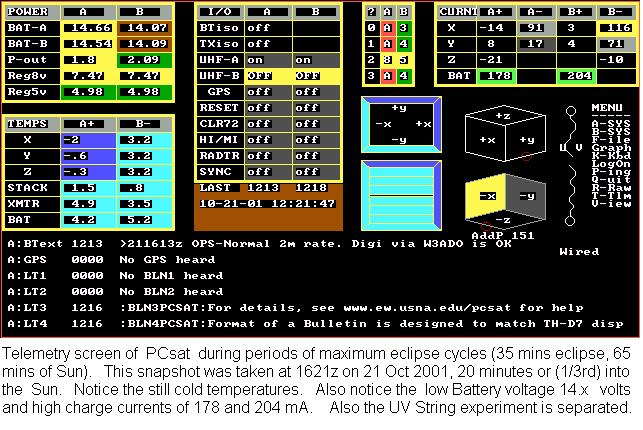
Data Analysis During this period, there are three general situations of interest. First is the declining power budget in early December due to the combination of a maximum 35% eclipse period, during the Winter Solstice and our failed -Z solar panel which points generally up in the southern Hemisphere. Next is the period of full Sun from about 7 to 23 January, followed by another period of maximum 35% eclipse in February leading to a minimum eclipse cycle of 15% on March 7th at the end of the data.
BINARY BITS: In all of the plots below, you can see the status of the 8 command bits. The first two we try to keep always RED meaning the UHF receivers are both commanded OFF. The 3rd bit is the GPS which was used during full sun between 7 to 21 January and the 6th bit toggles the GPS data between MITEL and NMEA format. Any toggles in the other bits are insignificant.
PCsat side A Telemetry - Primary user transponder on 145.827
Data Analysis: ALthough we have not thoroughly digested the trends in the data, there are a few observations we find interesting and worth of further analysis:
PCsat side B Telemetry - North American downlink on 144.39 (only special travelers)
|
|
|